Building on the momentum of one of our previous articles – in which we presented our proprietary methodology for the ESG commitment evaluation – within this text, we delve into the outcomes of our most recent study.
modefinance has utilized the described methodology to assess the EE-ESG score for a substantial sample of Italian companies that participated to the survey. This initiative represents a significant step towards enhancing sustainability awareness among SMEs.
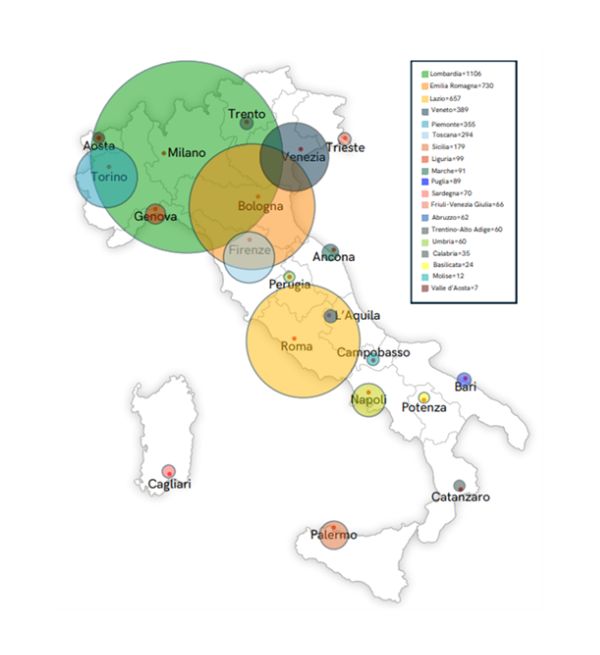
In total, 4,586 Italian enterprises participated in this assessment, representing 19 different regions across Italy. Lombardia emerged as the most represented region with 24% of the sample, followed by Emilia Romagna and Lazio at 15% and 14%, respectively. The diversity of regions involved highlights the widespread nature of this sustainability initiative.
When considering company size, small enterprises, those with a turnover ranging from €2 to €10 million and a workforce of 10 to 50 employees, dominated the sample at 50%. Micro-enterprises, with a turnover under €2 million and fewer than 10 employees, accounted for 20%, while the remaining 30% were medium-sized companies with a turnover exceeding €50 million and over 50 employees.
The panel of companies was categorized into 14 business sectors based on the NACE code, with manufacturing being the most prominent at 28%, followed by services (18%) and construction (17.7%). This comprehensive categorization allowed for a thorough analysis of the diverse SME landscape in Italy.
A crucial aspect of this initiative is the completeness of data provided by the surveyed companies. Notably, 93% of the companies completed the generic questionnaire, while just 9% managed to fill in the sector-specific section. This disparity suggests that many companies, particularly those in construction and manufacturing, may not yet be fully prepared or motivated to delve into more detailed ESG analyses. This points to the need for further strengthening sustainability awareness and policies among Italian SMEs.
EE-ESG scores were calculated for all sample companies using both generic and sector-specific models, assigning a confidence level (CL) with a median value of 82%. The CL reflects the percentage of available data considered for score assessment, weighing data importance.
Examining final EE-ESG Score-classes after the override step for companies with CL above 80% yields insightful findings. Introduced to prevent companies from entering the top Score-class category (S1, S2) without meeting minimum requirements, thresholds were set for each E, S, and G pillar’s driver scoring areas (Climate Change Mitigation and Energy Efficiency, Supply Chain and Business for Environmental, Social and Governance, respectively). Failure to surpass these thresholds renders a company ineligible for Dynamic macro-classes (S1, S2), leading to potential downgrades to S3 post-aggregation if driver scoring areas are not outperformed.
Only 2% of the sample was evaluated as vulnerable/high risk (S6-S7), while less than 1% achieved a low risk (S1-S2) rating. A significant proportion of the surveyed companies was positioned as responsible, with 43.7% falling into the S4 class. S3 and S5 had 25.5% and 28.2% of companies, respectively. This distribution emphasizes the varying commitment levels of companies to ESG measures, with a need for many to enhance their practices and policies.
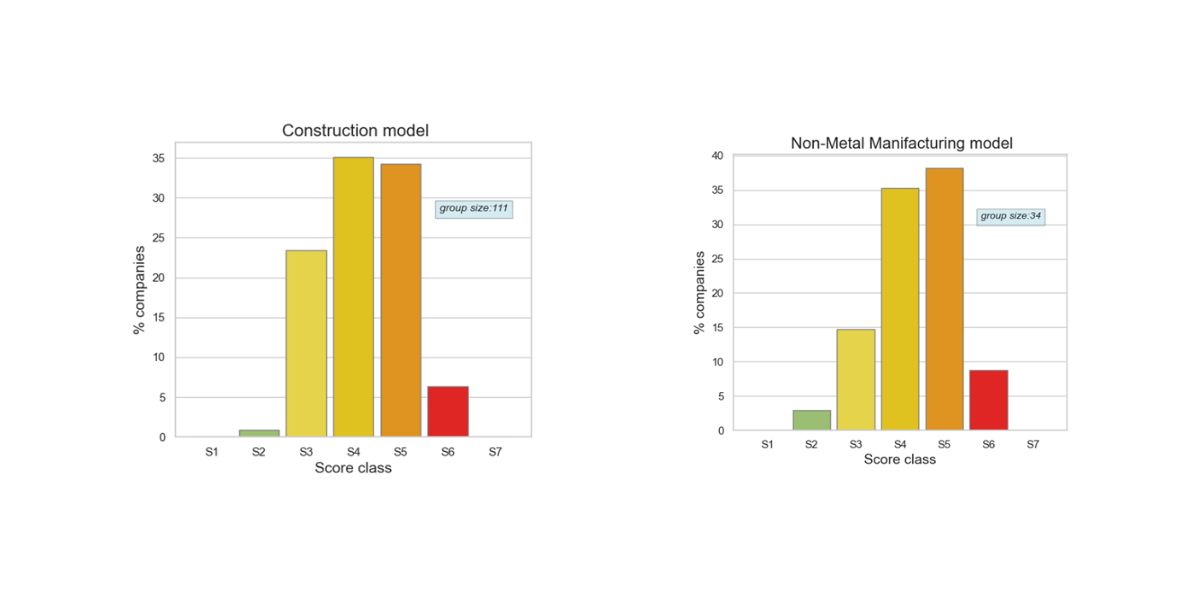
The distribution of EE-ESG Score-classes also aligns with the sector. Companies in construction and non-metal sectors display slightly higher risk values.
Key insights from the E, S, and G dimensions
An analysis of the individual E, S, and G dimensions provides deeper insights into the main drivers of the EE-ESG scores.
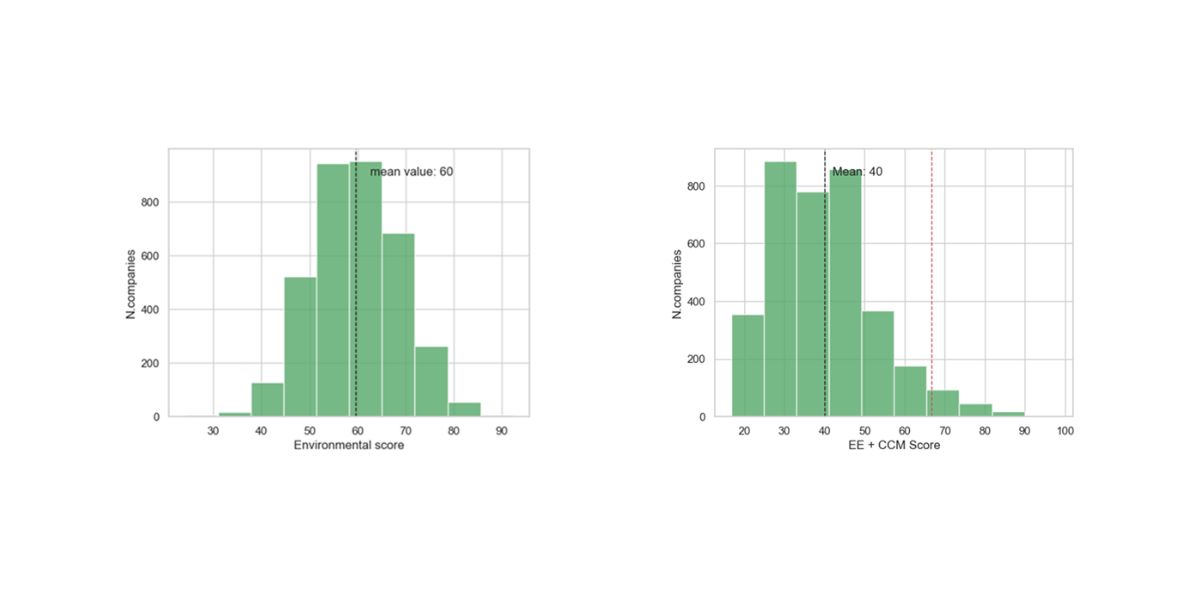
Environmental Score: a whopping 98% of companies received an Environmental score, with the median CL for this dimension at around 79%, which means that almost half of the interviewed companies left empty at least 20% of the information necessary to calculate the score. However, a minimum CL of 70% is seen as a threshold for a good-quality score. A total of 80% of companies exceeded this threshold, with the mean Environmental score for this group averaging around 60 out of 100. As driver scoring areas, Energy Efficiency and Climate Change Mitigation play crucial roles, and the survey revealed that – with a mean performance of about 40 out of 100 – companies struggled in these areas, indicating vulnerability to climate change-related risks. Moreover, the combination of Energy Efficiency and Climate Change Mitigation proved critical, with 17% of high-rated companies (S1-S2) experiencing downgrades during the override step. This highlights the importance of a holistic approach to sustainability.
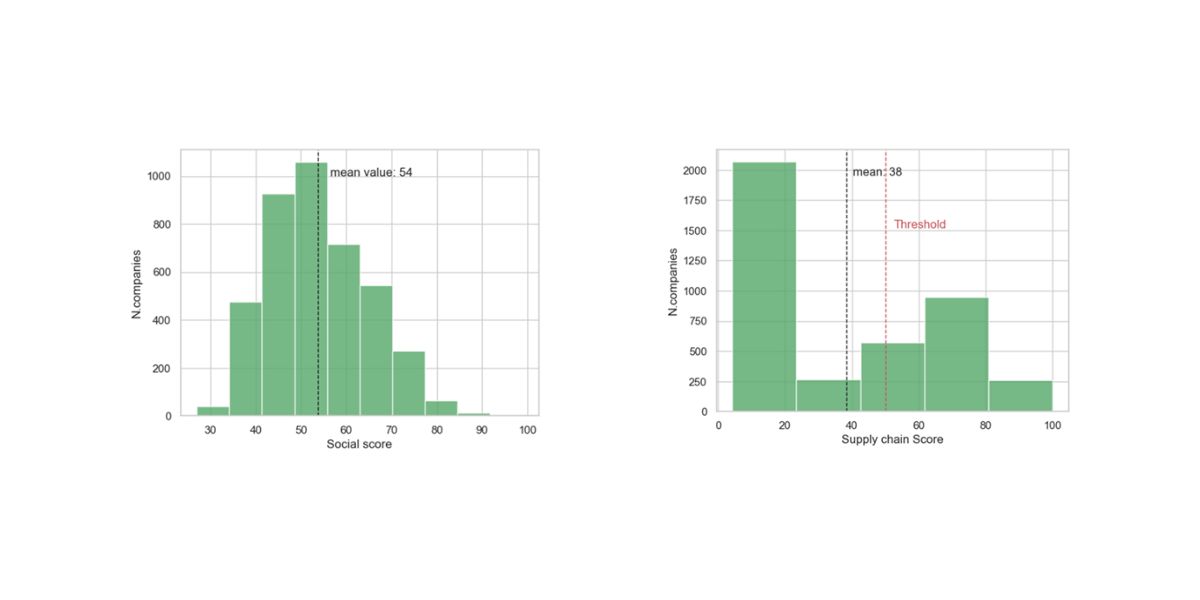
Social Score: All companies in the sample received a score for the Social dimension, with a median CL of approximately 78%. After applying a 70% threshold for CL, the sample size reduced by 10%, with the mean performance in the Social dimension at around 54 out of 100. The driver scoring area of concern is Supply Chain, where the mean score was 38 out of 100, and with 19% of companies facing downgrades during the override step due to low performance in social areas. This suggests that companies are ill-prepared to manage supply chain-related risks, reflecting a need for more resilient policies in this area.
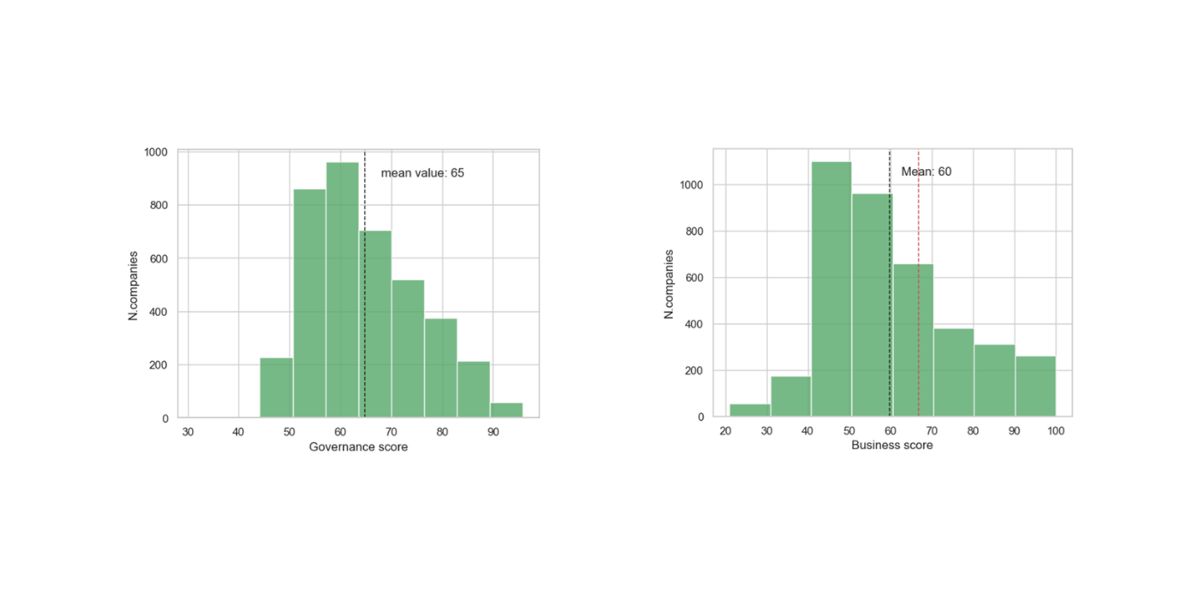
Governance Score: A robust 85% of companies received a Governance score, this dimension presenting the highest data completeness, with a median CL of 90%. All rated companies exceeded the 70% CL threshold. The Governance dimension scored the highest, with a mean score of 65 out of 100. This could be attributed to companies’ familiarity with governance and the attention it receives from regulations and best practices. If we look at the score of the driver area (Business), the mean value is 60 out of 100 confirming the value of the aggregate G-score.
Charting the ESG landscape
In conclusion, this study marks a significant stride in assessing the ESG commitment of Italian SMEs through the EE-ESG score algorithm developed by modefinance within the TranspArEEns project. Covering a diverse spectrum of approximately 4600 companies across Italy, the results underscore a prevalent median risk position (S4) in the overall ESG performance landscape.
While the pursuit of sustainability is recognized as a long-term investment, the analysis reveals that companies are in the nascent stages of this transformative journey. Methodologically, there is a recognized need for further refinement, particularly in introducing the concept of materiality with precision, incorporating metrics, and weighting maps to account for business-specific aspects and contextual factors such as risks associated with extreme events.
It is imperative that ESG risk models evolve dynamically over time, ensuring compliance with regulatory standards while remaining adaptable to integrate signals that align most effectively with each examined company’s unique profile. Continued efforts in these directions will not only enhance the accuracy of ESG evaluations, but also contribute to the broader sustainability objectives.