oplon Risk Platform: Augmented Analytics explained by those who do it
Let’s start from the very beginning: what does Augmented Analytics mean?
Here we’ll explain what it is and why it’s revolutionizing data analysis making it accessible to everyone.
Augmented Analytics is the technology of the future. That’s why we apply it in developing algorithms and analysis models for oplon Risk Platform, our AI-based platform for the exposure management and the automation of the decision-making process of rating assessment.
A new analytical approach
In 2017 Rita Sallman, Cindi Howson and Carlie Idonies introduced the notion of Augmented Analytics in a Gartner’s research paper, describing it as a new data analysis’ approach that automates insights using machine learning and natural-language generation (NLG).
It may seem a rough concept, but let's take a step back to see it from the right perspective.
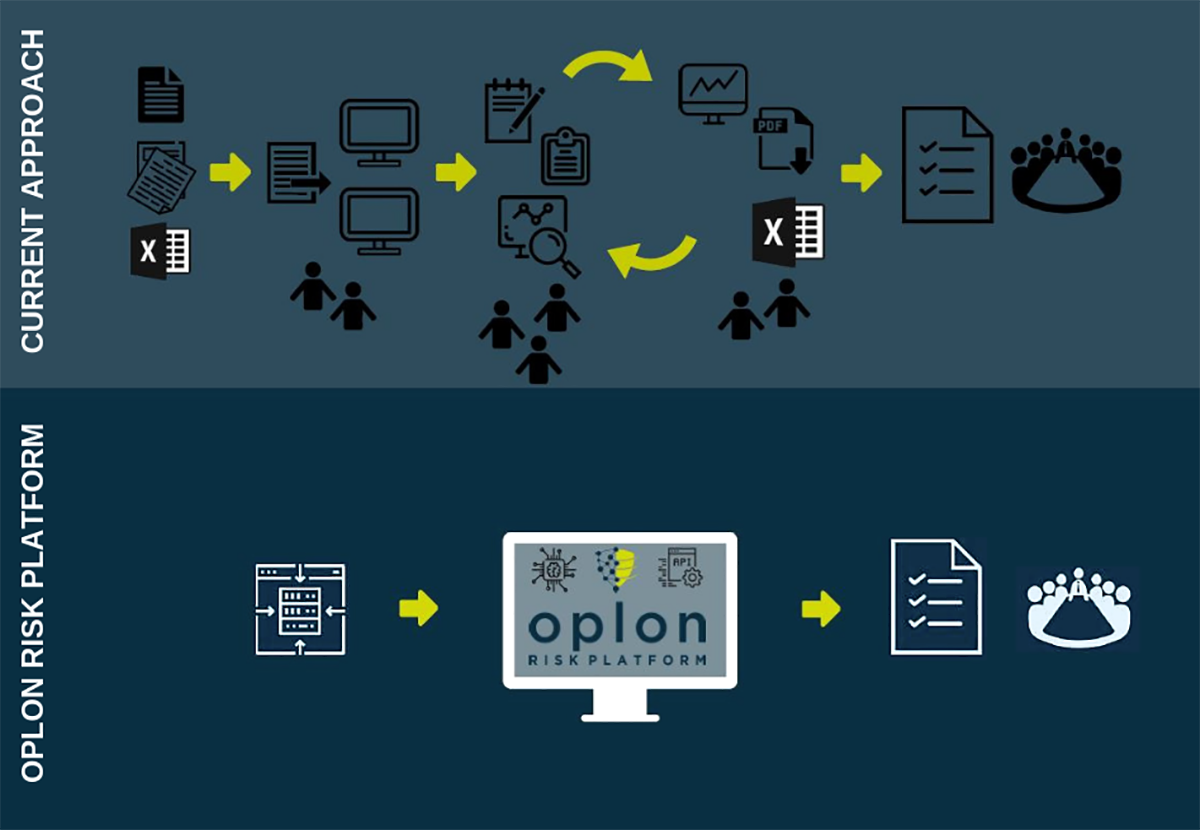
Current approach vs Augmented Analytics
Nowadays any company knows and handles data analysis as a fundamental step of a business strategy. Though, the current analysis approach can no longer process the increasing data amount, which makes exploration of data connection and the whole decision-making process extremely time-consuming.
Furthermore, the lack of data scientists may seem a second-rate problem, but it’s an ordinary challenge companies face (sorry, we already have the bests 😉).
What if analysis tools could interact with users using natural language, identifying automatically the more relevant findings?
That’s exactly what Augmented Analytics aims to do.
Exploiting self-learning methodologies, Augmented Analytics automates most of the analysis’ procedures and constantly increases its capabilities thanks to the experience gained with users and the information conveyed by external consultants.
Instead of dashboards, users can generate queries and receive insights in natural language through personal assistants, chatbots and conversational interfaces, which support the data presentation suggesting actionable solutions.
How to build Augmented Analytics models. oplon Risk Platform example
Let’snow see how to build Augmented Analytics algorithms and applications as we didon oplon Risk Platform.
1. Reversing the traditional analysis approach
The traditional analysis approach can be summarized as follows: an expensive and time-consuming process made of several analysis steps, each of which requires different skills and the collaboration of different experts (data scientists, data analysts, business managers and IT engineers). oplon merges all decision-making steps in a single platform provided with AI and ML-based tools, automatizing all the analysis procedures to let also non experts better understand data and insights.
2. Gathering data from different sources
Upload and download, drag and drop, cut and paste: data scientists spend most of their time collecting and cleaning data. Connecting external and internal services via API yield at least three benefits: it improves analysis’ quality and accuracy gathering data from different sources, it saves time in data processing and it reduces errors’ probability.
3. Including qualitative information
In data science, data is – of course – king. But not only numbers are data. Most of the information we receive every day is conveyed in form of words. So why not include them in the analysis? oplon’s analysis tools cover also questionnaires’ and files’ verbal information, which provide the qualitative data necessary to issue credit ratings.
4. Automatizing analysis’ procedures
Data are not only displayed graphically, they are also weighted and processed within the evaluation procedure, and they can affect significantly the rating outcome. For example, it is possible to calculate a company's rating from the balance sheet data and add afterwords the information conveyed by a credit bureau. Data are read and analyzed by the platform itself and the company's rating is automatically updated according to the new information.
5. Integrating custom models
Business Intelligence platforms provide only a limited number of analysis tools, forcing users to work on different applications and devices at the same time. oplon enables users to add custom models within the platform and to set them up as analysis steps of the rating evaluation process.
6. Developing Machine Learning and Artificial Intelligence algorithms
Thanks to AI and ML algorithms, oplon analyzes thousands of data simultaneously, finding the most significant correlations and disclosing unforseen insights. While traditional analysis tools provide historical representations of companies’ performance, oplon features predictive scenarios, allowing users to explore all the possible opportunities.
The future of Augmented Analytics
Augmented Analytics includes three different areas or evolution steps:
- Augmented data preparation: this includes Artificial Intelligence and Machine Learning algorithms for the collection, organization and integration of data coming from different sources. Many companies already exploit data preparation technologies, cutting down data elaboration costs and times;
- Conversational augmented analytics: we already widely described this step, which allows the so-called citizen data scientists (business people with no or little knowledge of data science) to use ML to automatically find and visualize the most relevant findings, without building analysis models. Users will be able to explore any dataset’s combination and relationship querying chatbots and conversational interfaces (for example “What can I do to improve sales”) and receiving detailed and significant insights;
- Augmented data science and machine learning: in the last step, ML and AI technologies will be able to automatically generate and manage augmented analysis models. This will free data scientists from time-consuming and repetitive tasks let them focus on more creative challenges, and will allow citizen data scientists to develop ML applications to be embedded within the models.
It will take a few years before Augmented Analytics will be widely employed, revolutionizing business management as much as Business Intelligence has done over the last decade. That’s why it has be defined “the next wave of analytics disruption”: there is enough room for invention and growth opportunities.