July 2020. We have (finally!) reached the midpoint of this terrible year.
At this stage, we would all like to forget about the Coronavirus, but the hypothesis of a second wave still raises concern.
In early March, we published research about the expected impact of Coronavirus on Italian enterprises. The analysis was performed through the forecasting model ForST, back when it was still impossible to predict how long the lockdown would have last.
As the months went by, the economic scenario became crisper and more varied.
Many companies successfully pursued smart-working activities, and some benefited from the liquidity measures put in place by the government. But a new epidemic wave threatens the solvency capabilities of these companies, seriously affecting the financial sector. Comprehensive statistical analyses are no longer sufficient to analyze the possible behavior of companies in the coming months; we need analysis models capable of assessing case-by-case situations.
ForST: Forecasting & Stress Test
The ForST model was already used to assess the evolution of companies' performance and test their resilience to financial shocks on an individual basis. However, in recent months we implemented a change that has further improved the model accuracy.
ForST is an analysis tool designed to process budget simulations up to 5 five years according to 3 different scenarios and to estimate the of the creditworthiness evolution of the analyzed entity. Also, the model allows to perform stress test analyses by modifying some of the input variables of the simulation. And this is where the main change occurred.
How the ForST model works
A (short) technical introduction is now required: to forecast business performance, For-St employes the clustering techniques used by Machine Learning algorithms. The model's algorithms group companies with significant common characteristics into clusters and, for each cluster identified, derive metrics and statistics to be used as benchmark. During the analysis process, the model maps the analyzed company within the most suitable cluster and estimates the most likely evolutionary path according to the cluster's statistics. Finally, the model simulated the balance sheet items, deducing from the behavior of the companies in the same cluster how the resources are likely to be used over time.
The model's evolution
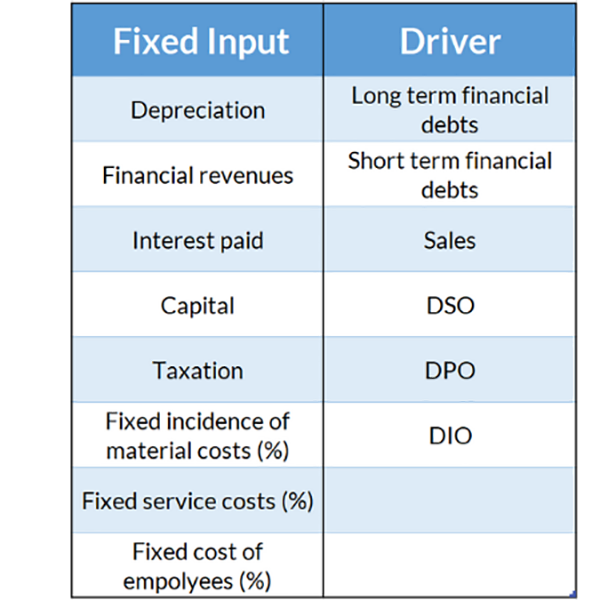
Driver and Fixed Input
With the last adjustment, variables users can work on to perform stress testing analysis have been divided into two categories, Drivers and Fixed Inputs. While the Fixed Input values entered by the user are only employed to balance the financial statement, Driver values determine the cluster the model will select as reference set to forecast the budget evolution. In this way, the balance sheet forecast will give even more accurate results.
Model accuracy
How accurate is the model? That is the question.
To answer it, let's look at the results obtained by the model validation performed on 2018 financial statements.
MORE Score comparison: ForST simulations vs. 2018 financial statements
To verify how accurately the model can forecast the creditworthiness evolution, we compared the actual credit score obtained by the company in 2018 with those forecasted by the model. The credit scores were calculated through MORE, modefinance's scoring methodology.
The transition matrix above shows the comparison between the results obtained with the For-ST model and the actual results as of 2018. Most of the scoring classes show an accuracy degree of over 80%, meaning the model has correctly forecast the performance of the analyzed companies. Even as concern the score classes that display less satisfactory results, such as C and CC, the model closely approximates the real value, assigning the score class immediately adjacent to the one reached by the analyzed company. Looking at the comparison between the score macro-classes, the degree of accuracy exceeds 79%.
Ratios comparison: ForST simulation vs. 2018 financial statements
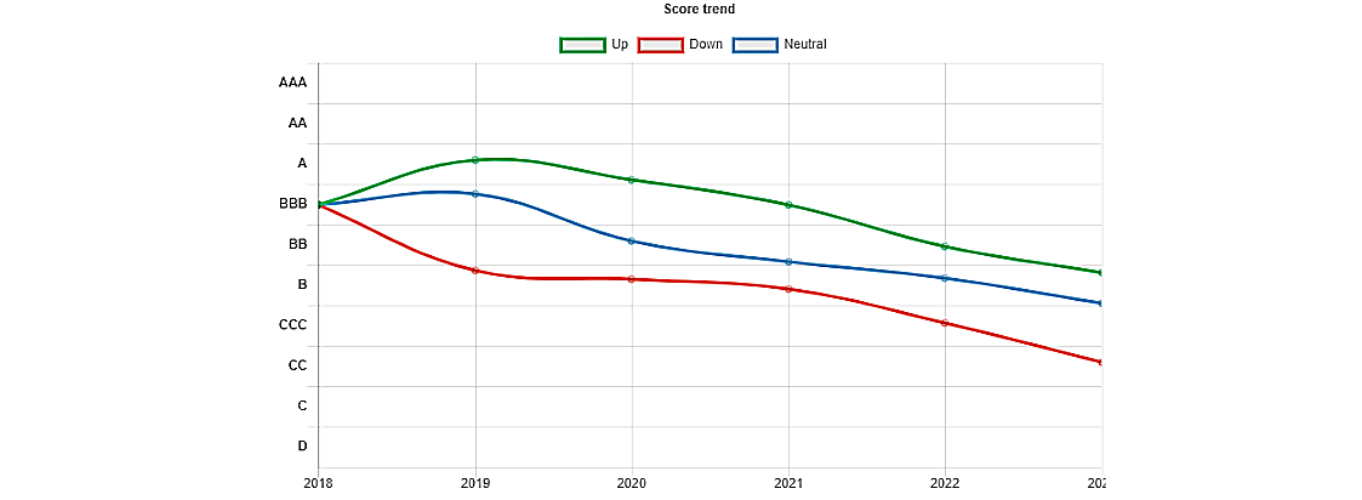
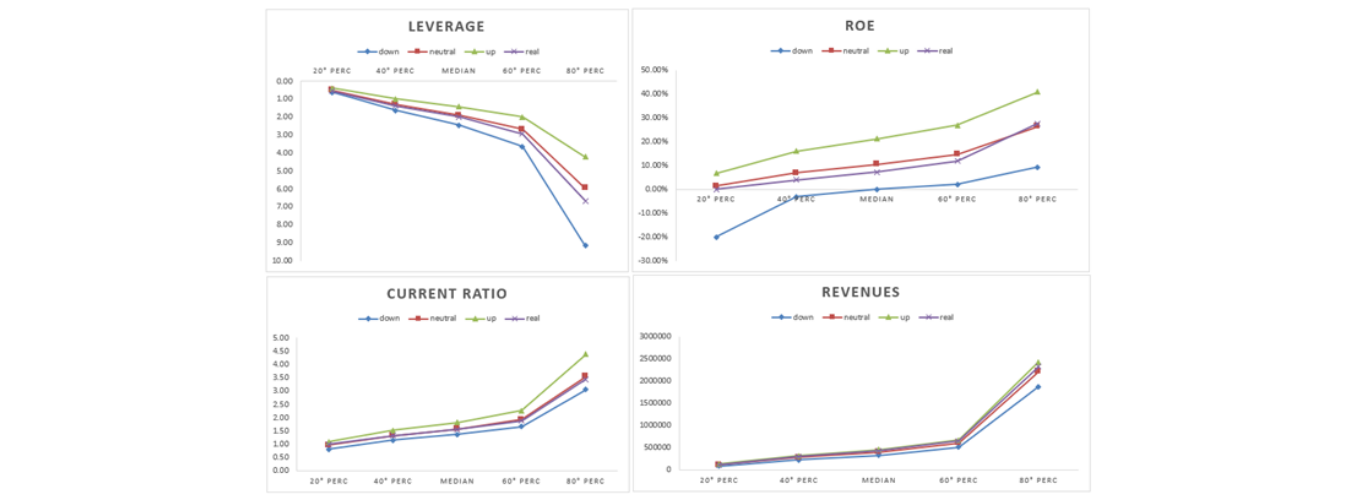
Let's escalate to a higher level of detail: how accurately can the model estimate specific balance sheet ratios? The graphs in the image below show the results obtained by the model according to the three different simulation scenarios.
For all the ratios considered, the curve of the neutral scenario closely approaches the real values assumed by the ratios in 2018.
Accuracy of the financial statement items: ForST simulation vs. 2018 financial statement
Finally, we verified the accuracy of For-ST model on specific items or areas. To validate the model, we adopted the Accuracy Rate metric, which indicates the percentage of companies of validation sample that meet at least one of the following conditions:
- the ratio between the simulated and the real values is below a specific threshold;
- 2018 balance sheet values range between the simulated values of the up and down scenarios.
The Accuracy Rate reached is between 75% and 85%.
A Rating-as-a-Service concept
The results of the model can be used as a basis for more in-depth analysis of the debt-capacity of single companies or entire portfolios. ForST is embedded in the Rating-as-a-Service platform developed by modefinance and finds its maximum application used in combination with the credit risk analysis tools within the platform. For more information, please find an information brochure at this link.